Table of Contents
The Data Insights page displays valuable usage data and trend charts for the One95™ platform.
Teacher, school, and district roll-up views of the same data empower key decision-makers to make informed curriculum and instructional choices.
Access the Data Insights page by selecting Data Insights from the navigation panel.
95 Literacy Intervention System™
If your district has the 95 Literacy Intervention System (LIS) enabled in the One95 platform, the Assessment Usage and Student Progress tabs will be available.
Contact your main district contact to learn more about the LIS.

Data Insights Overview
The Data Insights page is the One95 dashboard that offers centralized system insights and visibility to drive data-informed decisions. The goal of this page is to identify both patterns of excellence and areas of opportunity for improvement at scale across schools in your district.
There are three tabs within the Data Insights page: User Activity, Assessment Usage, and Student Progress.
The teacher, school, and district-level data displayed is updated nightly, so it reflects the latest from your district when you log in at the start of the school day.
User Activity Tab
The User Activity tab contains tiles related to the One95 data available from your district. This tab is available to all One95 platform users.
After selecting a tile, dynamic charts animate your district’s statistics over the last three months, including the current month. This allows you to visually compare school activities in a quick and digestible format.
Each user can access this page and see their measures for the current month and months prior throughout the school year. This data view can help educators understand how their platform activity and engagement change over time.
Navigating Charts
If there are more than 100 schools in your district, the top 100 schools are displayed within the User Activity charts. If there are fewer than 100 schools in your district, each eligible school will be displayed.
Schools are sorted from highest to lowest values. Note that schools with no values are not displayed.
Use your mouse or the scroll bar to view the statistics of all eligible schools.
Pause and move forward or backward while viewing the trending charts by using the icons in the upper right-hand corner.
- Click the pause icon to pause the animation on a given month. Click the play icon to resume the animation.
- Click the backward button to view the chart values from previous months (if applicable).
- Click the forward button to view the chart values from subsequent months (if applicable).
To view the animation from the beginning, ensure the charts are unpaused and click the relevant tile at the top of the page.
Navigate from high-level data to detailed data and vice versa by drilling down and up. Click on any school row to view the next level of detail.
After drilling down from school-level data, data is sorted from highest to lowest values.
Assessment Usage Tab
The Assessment Usage tab enables monitoring and evaluating the implementation and effectiveness of the LIS across the district, consolidating usage metrics, staff engagement data, and student progress indicators in a dashboard view.
The dashboard is organized into three sections: Schools Overview, Staff Overview, and Students Overview.
- The Schools Overview section provides insight into LIS school adoption.
- The Staff Overview section provides insight into staff engagement with the LIS.
- The Students Overview section provides insight into the educational impact of the LIS on students.
By default, each section considers unique schools, staff, and students within the latest school year.
Comprehensive filtering options allow educators to drill down into schools, One95 roles, grades, group types, assessment types, school years, and custom date ranges. Districts that have defined an organizational hierarchy may see up to two additional filters.
All LIS users can access this tab and view aggregated school, staff, and student data based on their role.
Note: Custom reporting capabilities are coming soon.Navigating Dashboard
Values will be rounded up or down using standard rounding logic.
Schools
Aggregated data from schools across the district will be displayed based on your role.
Staff
Aggregated data of staff across the district or your school(s) will be displayed based on your role.
Students
Aggregated data of students across the district or your school(s) will be displayed based on your role.
Student Progress Tab
The Student Progress tab aggregates assessment data across the district, providing district administrators and school-level leaders with 360-degree visibility into students’ skill progress.
Two metrics are available for analysis: proficiency results (i.e., proficient, below proficient, and well below proficient) and the total number of students assessed.
By default, students with at least one saved Phonological Awareness Screener for Intervention™ (PASI) and/or Phonics Screener for Intervention™ (PSI) assessment in the current school year are considered.
Skill proficiency data can be displayed as percentages or a total of proficient students. The percentage view uses color-coded cells that create a heat map, where color intensity is an additional indicator of the level of proficiency.
Comprehensive filtering and sorting options allow educators to drill down into schools, grades, school years, and custom date ranges, or view data aggregated at the district level.
Administrator, District, School, and Teacher roles can access this tab, view aggregated student data based on their role, and – if the ability to export student data is enabled – generate downloadable reports.
CSV exports identify students across the district who scored below proficient three or more times on the same skill.
Note: The ability to export aggregated student progress reports is coming soon.Navigating Table
Values will be rounded up or down using standard rounding logic.
Use your mouse or the scroll bar to view the statistics of all eligible schools and grades.
Schools
Aggregated data of schools across the district will be displayed based on your role.
- Schools with assessment data are displayed at the top of the table, sorted in ascending alphabetical order.
- Schools with no assessment data are displayed at the bottom of the table, sorted in ascending alphabetical order.
Grades
Aggregated data of grades across the district or your school(s) will be displayed based on your role.
- Grades with assessment data are displayed at the top of the table, sorted in ascending numerical order.
- Grades with no assessment data are displayed at the bottom of the table, sorted in ascending numerical order.
Data Settings
One95 Administrators have exclusive access to the Settings page, where platform settings are configured.
The Environment tab controls platform-wide defaults for the LIS. These settings drive the behavior of the Assessment Usage and Student Progress tabs.
Export Settings
The Environment tab determines your district’s export settings. From here, One95 Administrators manage the ability to download student reports.
This setting is disabled by default, meaning the Export button will be hidden on the Student Progress tab.
School Year Settings
The Environment tab determines your district’s school years. From here, One95 Administrators define custom date ranges to filter the assessment data throughout the platform.
The current school year, as defined by One95 Administrators, filters the aggregated data considered in the Assessment Usage and Student Progress tabs.
Two date ranges are available by default (each representing the current and previous school year), meaning the aggregated data may be filtered based on the current default school year.
To learn more about the Environment tab, reference our article on Settings | Environment Page.
Data Visibility
School and grade data visibility within the Student Progress tab is driven by the scope of student data permitted to be displayed and accessed by each role.
School
Each user can either view their rostered school(s) or all the schools in the district.
Grade
Each user can either view grades across their rostered school(s) or all the schools in the district.
User Activity Tab
The User Activity tab aggregates key metrics related to your district's One95 user base activity and 95 Percent Group resource usage.
There are three tiles at the top of this tab: District Logins This Month, Active Resources Users, and Resource Access Minutes.

Click each tile to view the trending charts.
After navigating to the Data Insights page, the District Logins This Month tile is selected by default.
District Logins This Month
The District Logins This Month tile displays the total number of user logins in your district during the current month.
The details are shown in the trending charts below the tiles in the District Logins per Month section. The charts visualize the number of logins per school per month.

From here, drill down from school-level data to user-level data. This outlines the number of times each active user in the school logged in during a given month.

Drill up by clicking All Schools below the District Logins per Month section header.
Active Resources Users
The Active Resources Users tile displays the total number of users in your district who have accessed 95 Percent Group resources during the current month.
The details are shown in the trending charts below the tiles in the Active Resource Users per Month section. The charts visualize the number of active resource users per school per month.

From here, drill down from school-level data to resource-level data. This outlines the resources accessed in the school and the number of users accessing them during a given month.

Drill up by clicking All Schools below the Active Resource Users per Month section header.
Resource Access Minutes
The Resource Access Minutes tile displays the total number of minutes spent accessing resources in your district during the current month.
The details are shown in the trending charts below the tiles in the Resource Access Minutes per Month section. The charts visualize the number of resource access minutes per school per month.

From here, drill down from school-level data to resource-level data. This outlines the resources accessed in the school and the number of minutes spent accessing them during a given month.

Drill up by clicking All Schools below the Resource Access Minutes per Month section header.
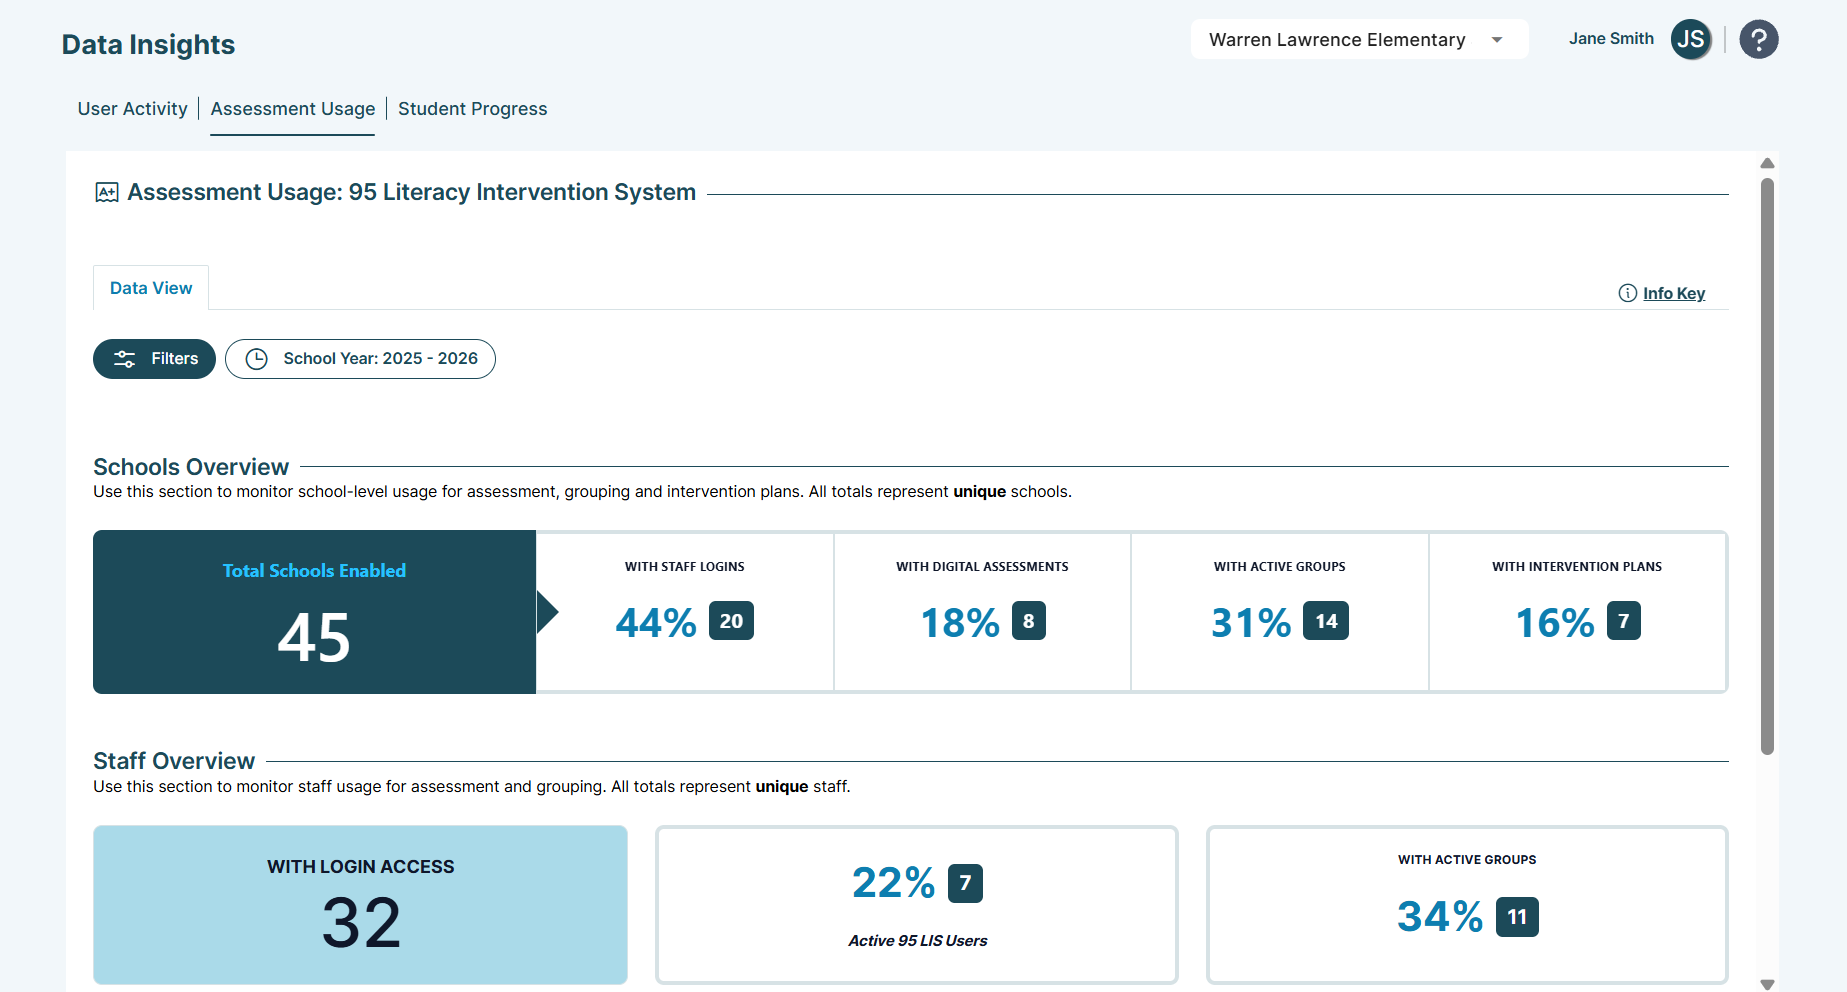
Assessment Usage Tab
The Data Insights page’s Assessment Usage tab aggregates key metrics related to your district’s LIS usage.
Please see the following video for an overview of the latest Assessment Usage tab enhancements:
There are three sections in this tab: Schools Overview, Staff Overview, and Students Overview.
Hover over the Info Key button to reference the dashboard values criteria at any time.
Filtering
By default, the dashboard displays aggregated data across the district in the current school year.
Filter data by clicking Filters at the top of the dashboard. This expands the filter panel.
Select one or more filter options, then click Update to apply them.
- Hide the filter panel by clicking the Hide button. This retains any filtering criteria.
- Remove individual filters by clicking them and selecting the X icon.
- Remove all filters by clicking Clear All.
- Add additional filters by clicking the Edit button.
Note: Additional filters may be available based on your district’s data.
School
Use the School drop-down to filter data by school.
Role
Use the Role drop-down to filter data by One95 role.
Grade
Use the Grade drop-down to filter data by grade.
Note: The available grades are synchronized with your district’s rostering platform.
Group Type
Use the Group Type drop-down to filter data by tiers of instruction.
Assessment Type
Use the Assessment Type drop-down to filter data by assessment type.
School Year
Use the School Year drop-down to filter data by school year or a custom date range.
This drop-down defaults to the current school year, as defined by One95 Administrators in the Settings page’s Environment tab.
A default date range will be displayed if:
- One95 Administrators have not modified the default current school year
- Defined school years do not include the current date
- No school years have been defined
Additional school year filters may be available based on your district’s school year settings.
Select the Custom Date Range option to enter a custom date range in the right-hand date range field. Start and end dates can be manually entered in MM/DD/YYYY format or selected via the calendar picker.
Schools Overview
The Schools Overview section aggregates data related to LIS school adoption.
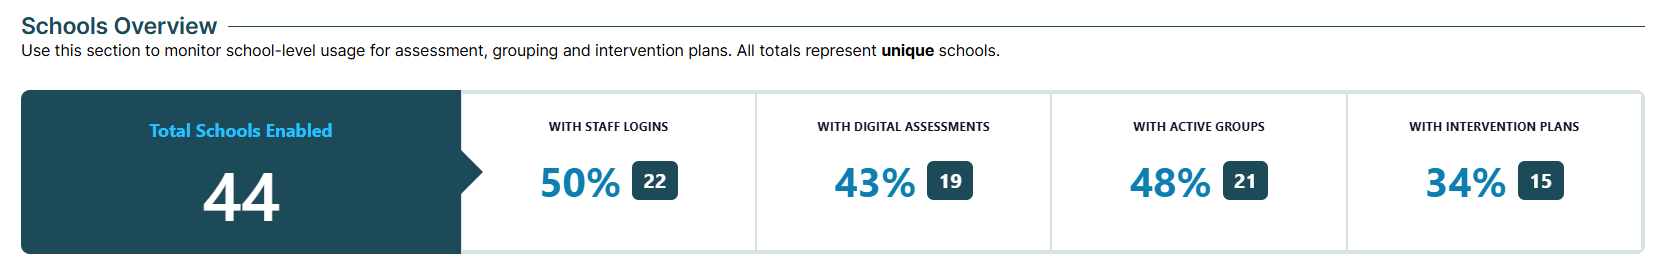
Total Schools Enabled
The Total Schools Enabled tile displays the total number of schools with the LIS enabled during the current school year.
Schools With Staff Logins
The Schools with Staff Logins tile displays the percentage of schools with the LIS enabled where at least one staff member logged in during the current school year.
The total number of eligible schools is displayed alongside the percentage.
Schools With Digital Assessments
The Schools with Digital Assessments tile displays the percentage of schools with the LIS enabled where at least one digital assessment, regardless of type, was administered and saved during the current school year.
The total number of eligible schools is displayed alongside the percentage.
Schools With Active Groups
The Schools with Active Groups tile displays the percentage of schools with the LIS enabled with at least one active group, regardless of type, during the current school year.
The total number of eligible schools is displayed alongside the percentage.
Schools With Intervention Plans
The Schools with Intervention Plans tile displays the percentage of schools with the LIS enabled where at least one intervention plan had an active cycle, regardless of whether the cycle is still active, during the current school year.
The total number of eligible schools is displayed alongside the percentage.
Staff Overview
The Staff Overview section aggregates data related to staff engagement with the LIS.
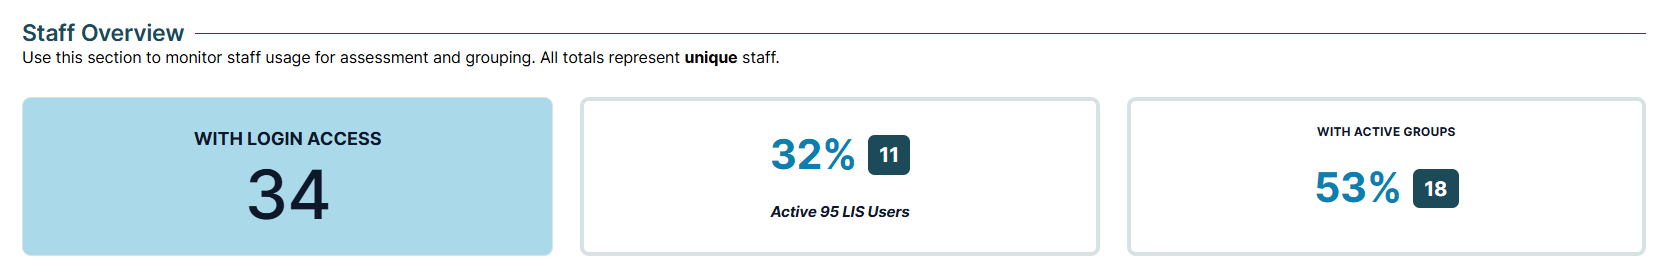
Staff With Login Access
The Staff with Login Access tile displays the total number of staff in schools with the LIS enabled who logged in at least once during the current school year.
Active 95 LIS Users
The Active 95 LIS Users tile displays the percentage of staff in schools with the LIS enabled who administered and saved at least one digital assessment, regardless of type, during the current school year.
The total number of eligible staff is displayed alongside the percentage.
Staff With Active Groups
The Staff with Active Groups tile displays the percentage of staff in schools with the LIS enabled who were assigned as group leaders for at least one active group, regardless of type, during the current school year.
The total number of eligible staff is displayed alongside the percentage.
Students Overview
The Students Overview section aggregates data related to the educational impact of the LIS on students.
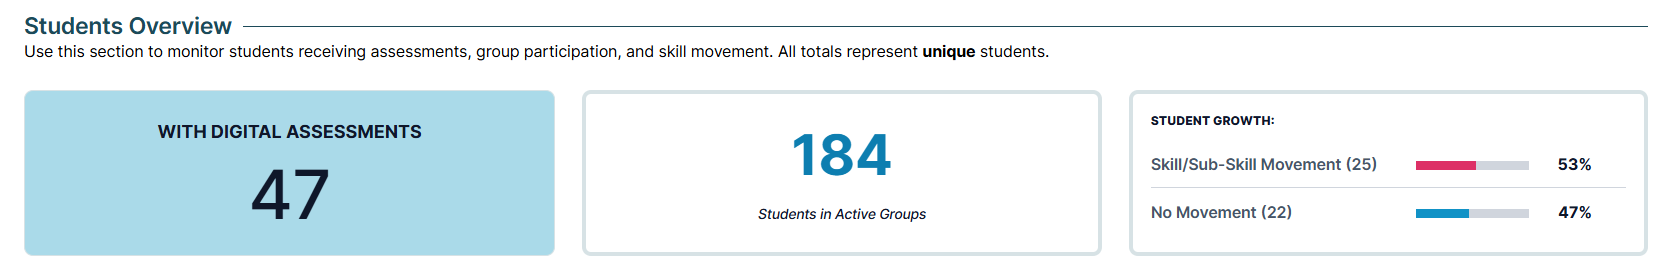
Students With Digital Assessments
The Students with Digital Assessments tile displays the total number of students in schools with the LIS enabled who were administered at least one saved digital assessment, regardless of type, during the current school year.
Students in Active Groups
The Students in Active Groups tile displays the total number of students in schools with the LIS enabled who were involved in an active group, regardless of type, at any point during the current school year.
Student Growth
The STUDENT GROWTH tile displays the percentages of students in schools with the LIS enabled whose skill or subskill proficiency improved and stayed the same during the current school year.
Note: Growth is determined by whether students' scores improved between their two most recent saved assessments on the same skill or subskill.
The total number of students is displayed alongside each metric.
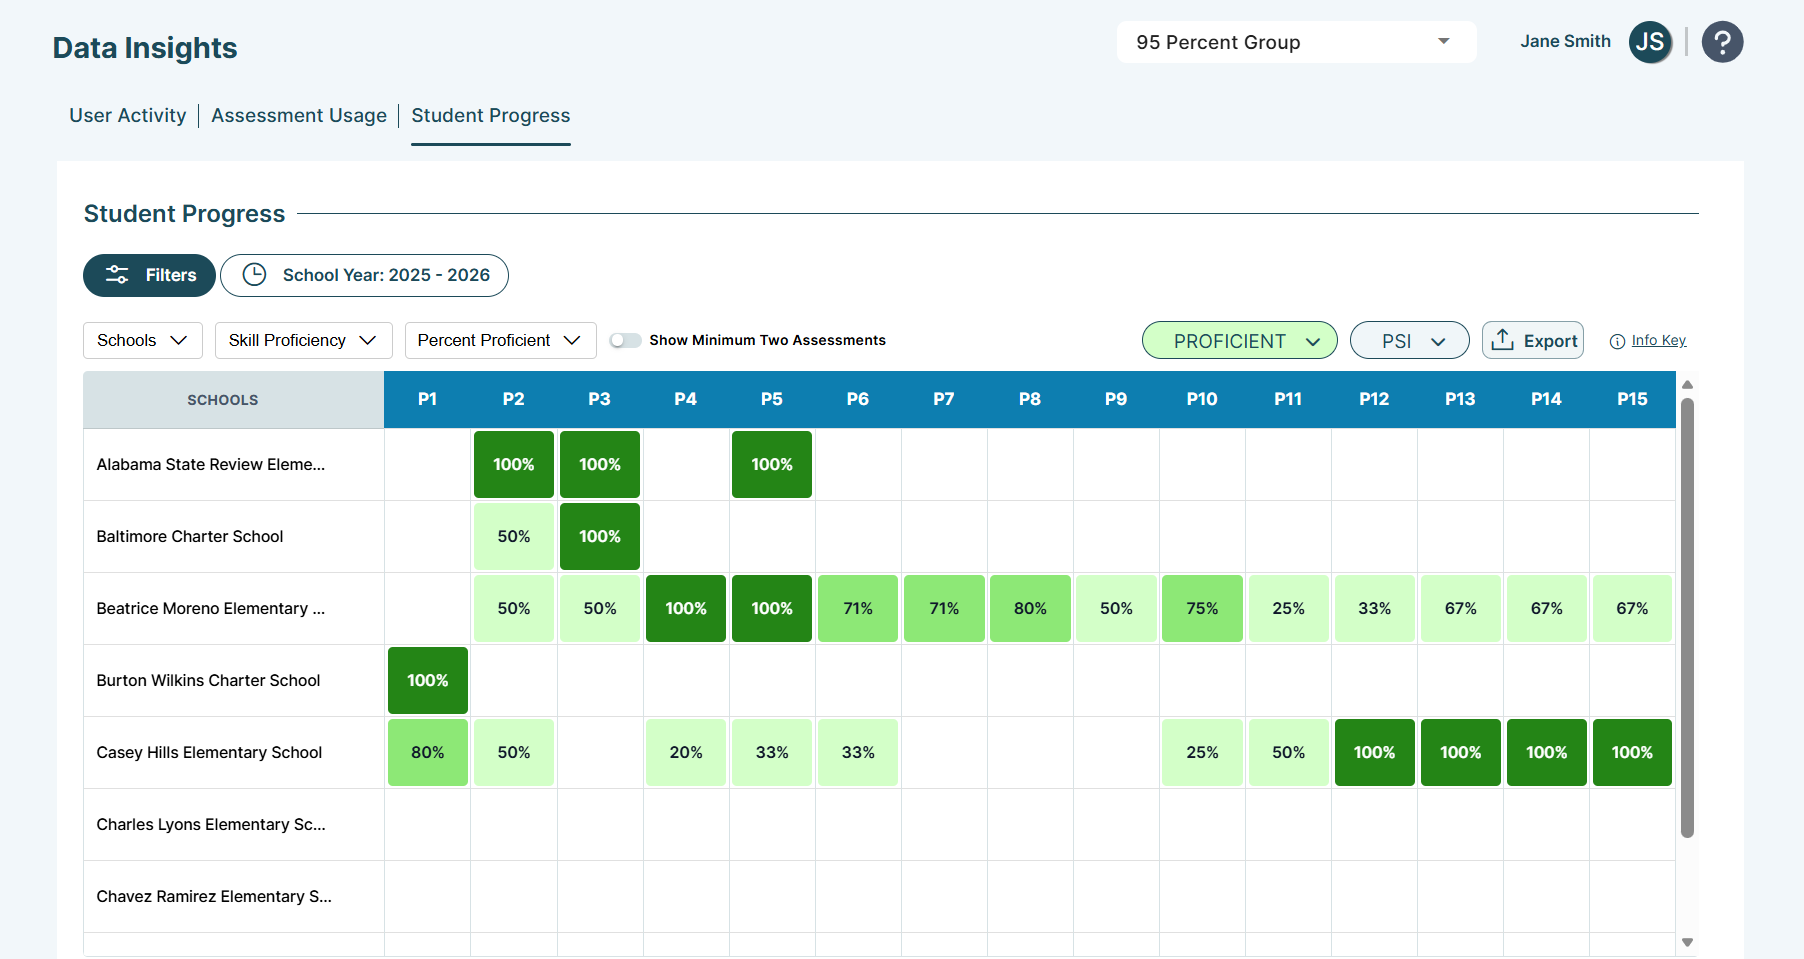
Student Progress Tab
The Student Progress tab aggregates assessment data across the district, displaying a skill continuum with each column representing a skill.

Please see the following video for an overview of the latest Student Progress tab enhancements:Reference the "Reporting" section of this article to learn more.View aggregated data by proficiency results and the total number of students assessed using the Skill Proficiency drop-down above the table.
By default, the percentage of students demonstrating PSI skill proficiency in each school in the current school year is displayed.
- Toggle between PSI and PASI results using the PSI drop-down above the table.
- Toggle between skill proficiency data displayed as percentages or a total of proficient students using the Percent Proficient drop-down.
- Toggle between viewing data by schools and grades using the Schools drop-down.
Depending on the assessment type selected, the table columns are labeled P1 through P15 or PA1 through PA11. These columns represent the 15 PSI skills and 11 PASI skills, respectively.
Hover over the columns to view the skill names. Look down on each column to view each school or grade's skill proficiency percentage or total of proficient students.
- If Percent Proficient is selected, reference the percentage of students in the school or grade showing proficiency on at least one saved assessment.
- If Number of Students is selected, reference the number of students in the school or grade showing proficiency on at least one saved assessment.
Enable the Show Minimum Two Assessments toggle to filter assessment results for students on a specific skill only when students have a minimum of two saved assessments on the same skill. This removes data for students without multiple assessments, which may indicate that they were proficient and did not require intervention, or they were below proficient but left the program before receiving instruction.
Toggle between proficiency levels (i.e., proficient, below proficient, and well below proficient) using the PROFICIENT drop-down.
PSI Assessments
- Proficient is defined as a mastery of 90% or better.
- Below proficient is defined as a mastery of 70-89%.
- Well below proficient is defined as a mastery of below 70%.
PASI Assessments
- Proficient is defined as a mastery of 80% or better.
- Below proficient is defined as a mastery of 60-79%.
- Well below proficient is defined as a mastery of below 60%.
Hover over the Info Key button to reference proficiency criteria at any time.
The percentage view uses color-coded cells that create a heat map, where color intensity is an additional indicator of the level of proficiency.
When PROFICIENT is selected:
- Dark green indicates that the proficiency percentage is between 91 and 100%.
- Medium-dark green indicates that the proficiency percentage is between 81 and 90%.
- Medium-light green indicates that the proficiency percentage is between 71 and 80%.
- Light green indicates that the proficiency percentage is less than 71%.
When BELOW is selected:
- Dark orange indicates that the proficiency percentage is between 91 and 100%.
- Medium-dark orange indicates that the proficiency percentage is between 81 and 90%.
- Medium-light orange indicates that the proficiency percentage is between 71 and 80%.
- Light orange indicates that the proficiency percentage is less than 71%.
When WELL BELOW is selected:
- Dark red indicates that the proficiency percentage is between 91 and 100%.
- Medium-dark red indicates that the proficiency percentage is between 81 and 90%.
- Medium-light red indicates that the proficiency percentage is between 71 and 80%.
- Light red indicates that the proficiency percentage is less than 71%.
Hover over the Info Key button to reference the heat map color criteria at any time.
Sorting
Sort aggregated data by clicking the columns in the table.
- When schools are displayed, clicking the SCHOOLS column sorts data by school in ascending or descending alphabetical order.
- When grades are displayed, clicking the GRADE column sorts data by grade in ascending or descending numerical order.
- Clicking the skill columns sorts data by proficiency in ascending or descending order.
Filtering
By default, the table displays aggregated data across the district in the current school year.
Filter data by clicking Filters above the table. This expands the filter panel.
Select one or more filter options, then click Update to apply them.
- Hide the filter panel by clicking the Hide button. This retains any filtering criteria.
- Remove individual filters by clicking them and selecting the X icon.
- Remove all filters by clicking Clear All.
- Add additional filters by clicking the Edit button.
School
Use the Schools drop-down to filter data by school.
Mark the District checkbox to view data aggregated at the district level based on the school(s) available to you.
Grade
Use the Grades drop-down to filter data by grade.
School Year
Use the School Year drop-down to filter data by school year or a custom date range.
This drop-down defaults to the current school year, as defined by One95 Administrators in the Settings page’s Environment tab.
A default date range will be displayed if:
- One95 Administrators have not modified the default current school year
- Defined school years do not include the current date
- No school years have been defined
Additional school year filters may be available based on your district’s school year settings.
Select the Custom Date Range option to enter a custom date range in the right-hand date range field. Start and end dates can be manually entered in MM/DD/YYYY format or selected via the calendar picker.
Reporting
If the ability to export student reports is enabled, click the Export button above the table to generate a CSV report of students who scored below proficient (i.e., below and well below) three or more times on the same PSI or PASI skill.
Click the Customize Report button to configure the report parameters: date range and assessment type.
Select Date Range
Determine the assessment date range considered in the Select Date Range section.
Select a Report
Determine the skills considered in the Select a Report section: PSI or PASI.
Click Download Report once complete. The file will be downloaded locally.
Below proficiency reports display one row per student and eligible skill. Rows are sorted alphabetically by school name, and then alphabetically by students’ last names.
Each row includes students’ district, school, group information across all types (i.e., Tier 2, Tier 3, and Classroom), ID, names, and grade, along with the assessment type administered (i.e., PSI or PASI), and skill information.
From there, students’ last three skill assessments below proficiency are displayed from newest to oldest. The percentage score(s), administration date, and assessor are included for each assessment.
Additionally, each row captures the total number of skill attempts below proficient, the total number of weeks since the student’s first assessment below proficient, and the administration date itself.
95 Percent Group Support is here to help! Contact us via the knowledge base support form.
To learn more about submitting tickets, reference our article on One95 Support.
Was this article helpful?
That’s Great!
Thank you for your feedback
Sorry! We couldn't be helpful
Thank you for your feedback
Feedback sent
We appreciate your effort and will try to fix the article